When a test pays off at dry-off
Before a dairy cow's dry period, farmers used to give every cow antibiotics. To fight resistance, many now treat only the cows a test flags. But which test, for which herd — and is it better than treating all, or none?
Born from the forecast
Singularity forecast that decision curve analysis — the tool doctors use to decide whether a diagnostic test is worth acting on — would enter animal science, where no work used it. It is a “classic and unexpected” forecast: a method thirty years old in medicine, absent from the whole field of agricultural and biological sciences. We searched for decision curves of dry-cow therapy and found none.
What we found
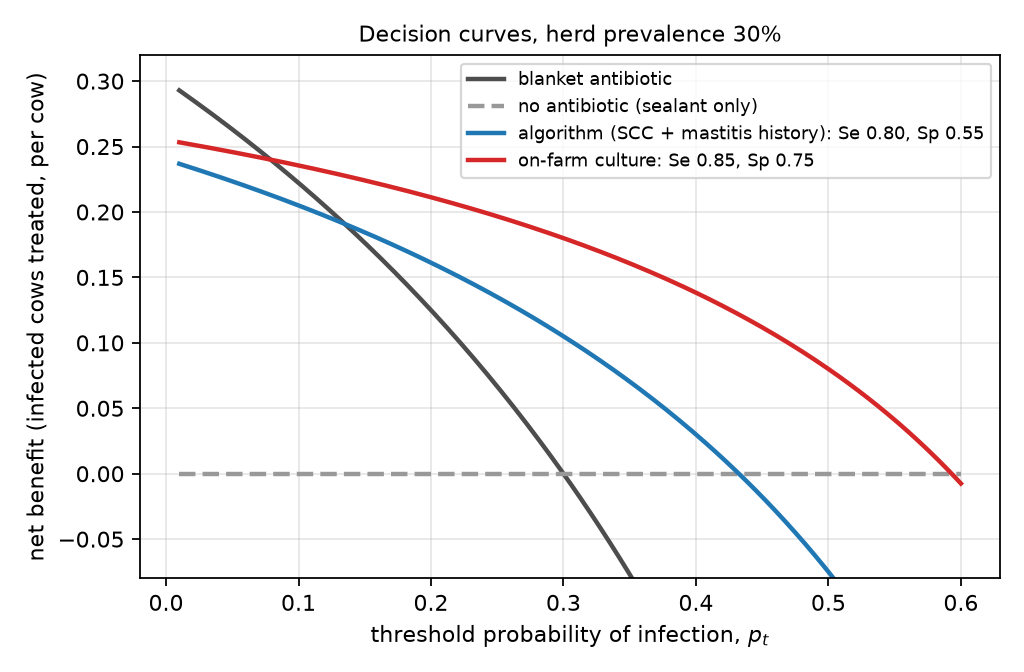
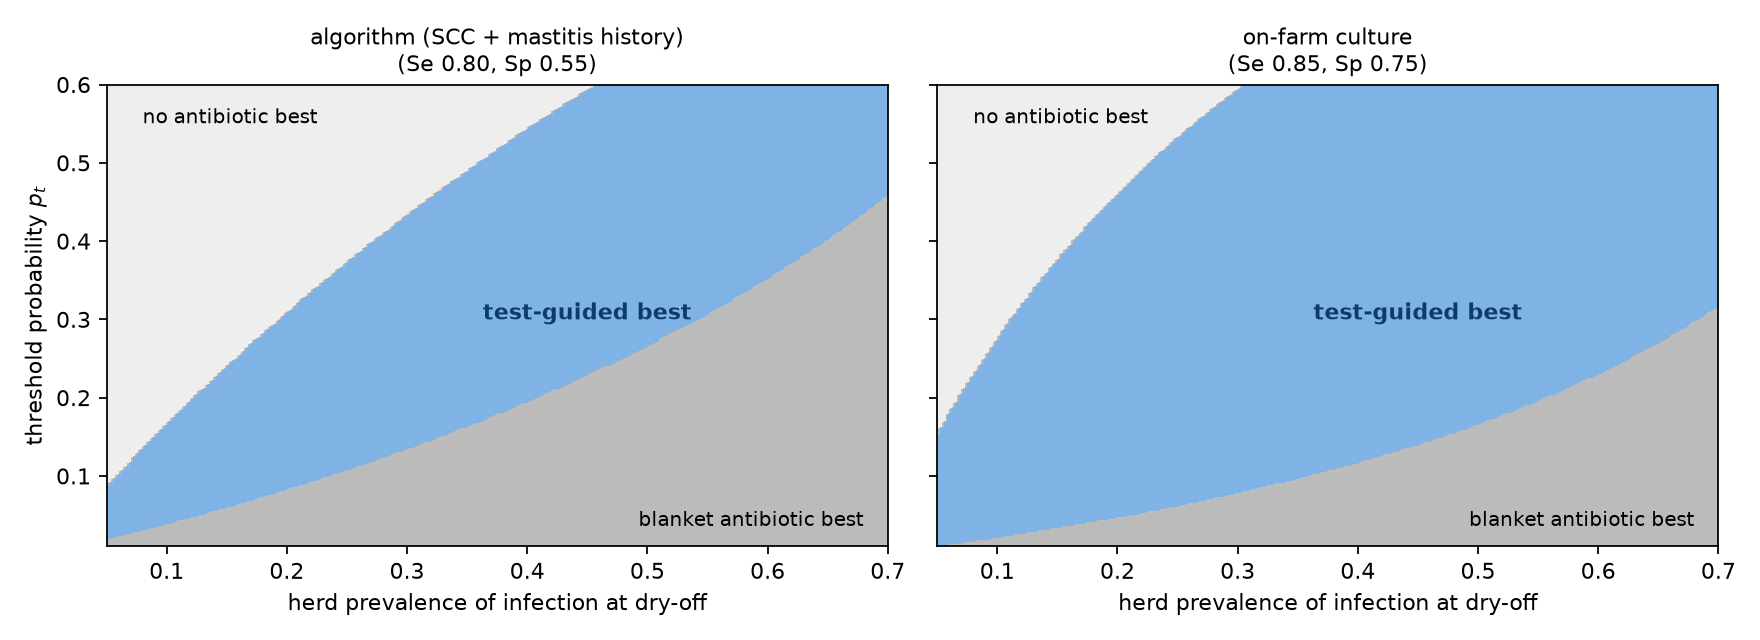
A clean rule. With herd prevalence π, test sensitivity Se and specificity Sp, a test-guided strategy beats both treating every cow and treating none exactly when the farm's threshold odds w lies between (1−Se)π / (Sp(1−π)) and Se·π / ((1−Sp)(1−π)). The threshold is a single number that says how much the farm cares about avoiding an unnecessary antibiotic compared with leaving an infection untreated.
Why it matters
Partial budgets speak in money; regulations speak in antibiotic use. Decision curves put both in one picture a vet can read for a given herd, and say when a free algorithm is good enough and when culture is worth it.
The paper
When does a test pay off at dry-off? Decision curve analysis for selective dry-cow therapy
· November 2026 · preprint
Abstract
Selective dry-cow therapy gives antibiotics at dry-off only to cows that a test flags as infected, and an internal teat sealant to all. Evaluations so far use sensitivity and specificity, or partial budgets in currency. Neither answers the question a veterinarian faces: for my herd and my view of the trade-off between antibiotic use and missed infections, is the test better than treating every cow, or none? Decision curve analysis answers exactly this through the net benefit across threshold probabilities. We give the closed-form conditions under which a test-guided rule beats blanket therapy and no antibiotics. In an illustrative herd with 30% prevalence, an algorithm with Se 0.80, Sp 0.55 is best for thresholds between 13.5% and 43%, and an on-farm culture with Se 0.85, Sp 0.75 for thresholds between 8% and 59%. Under parameter uncertainty the culture-guided rule is best with probability above 0.8 for thresholds between 11.5% and 47%.
Limitations
Parameter values are illustrative and should be replaced with herd data; dry-period cure and new-infection dynamics are summarised in a single benefit term; quarter-level decisions are not modelled.